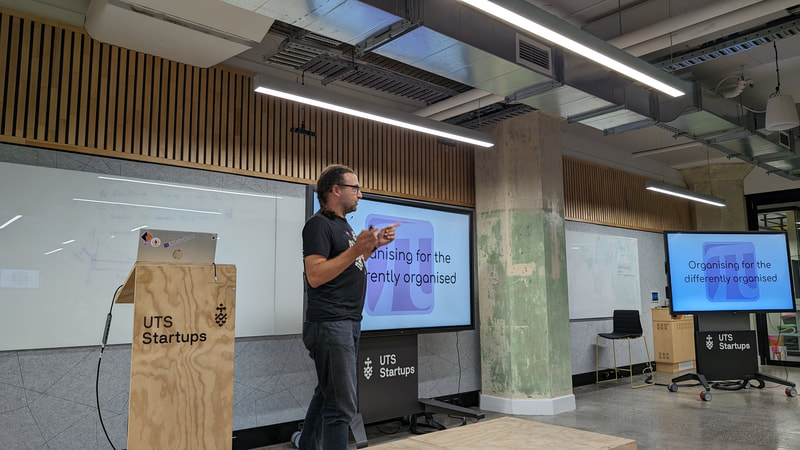
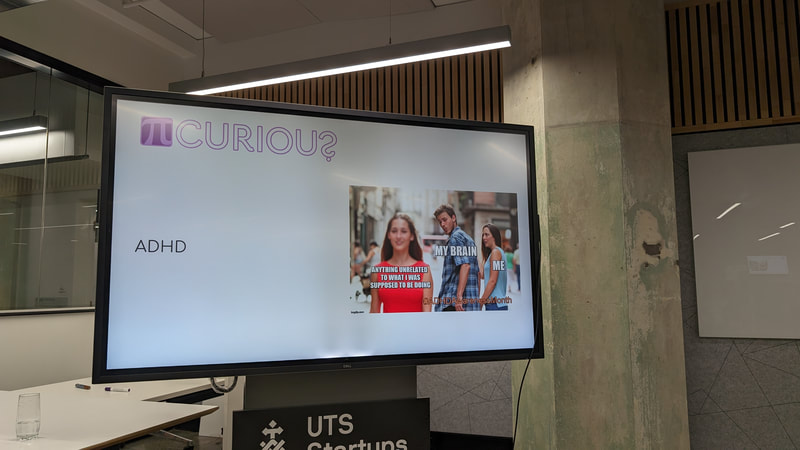
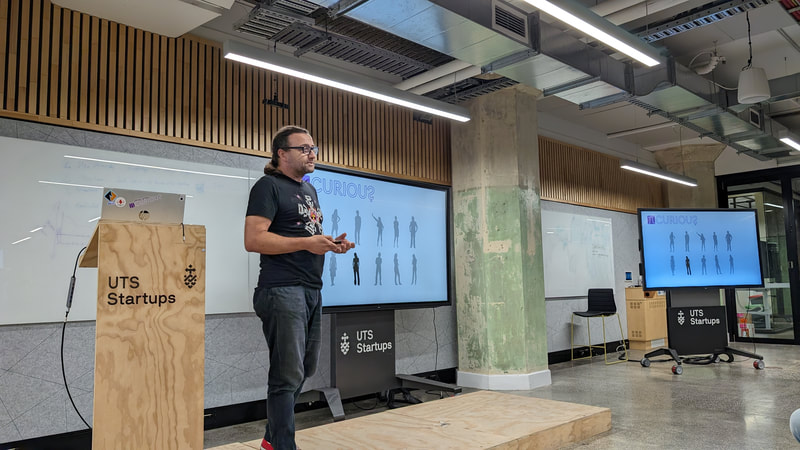
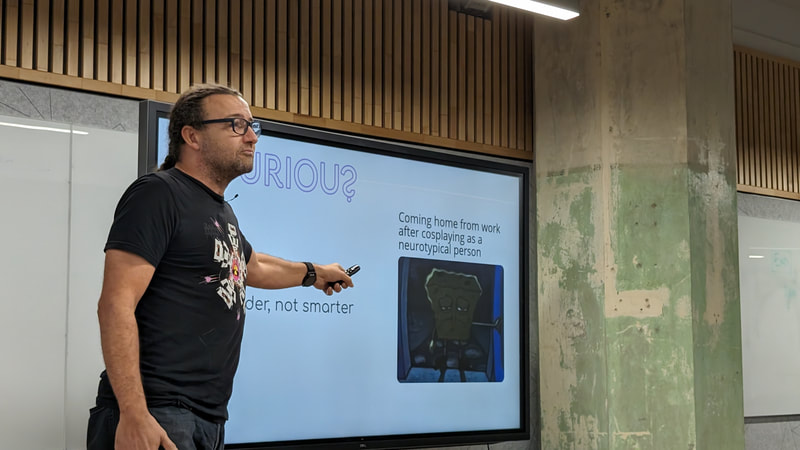
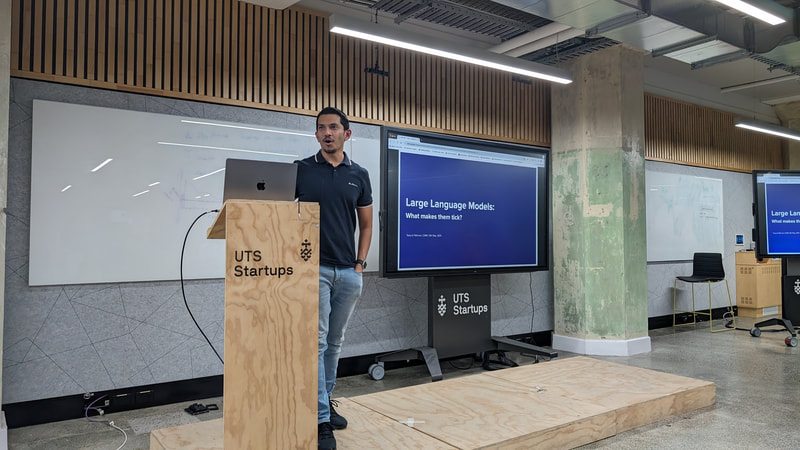
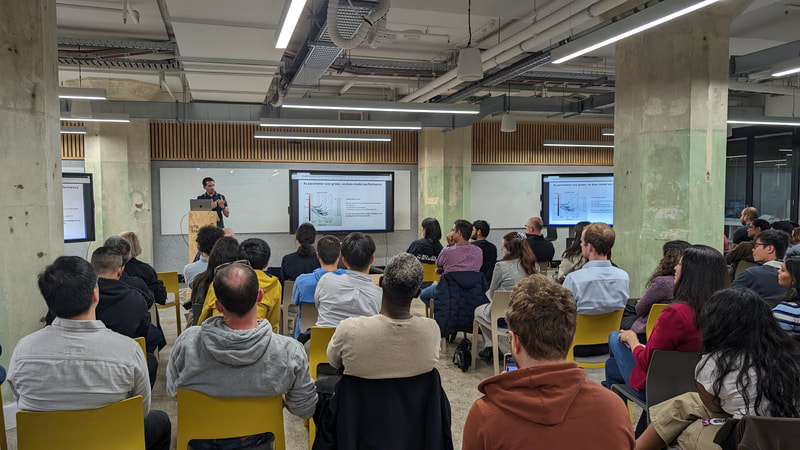
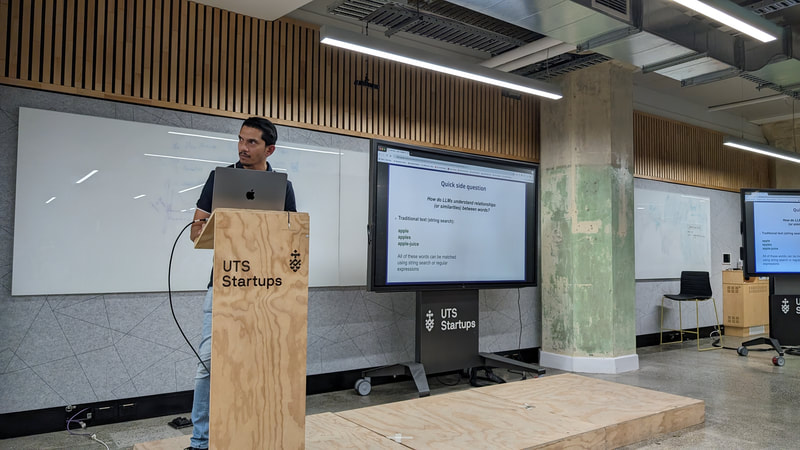
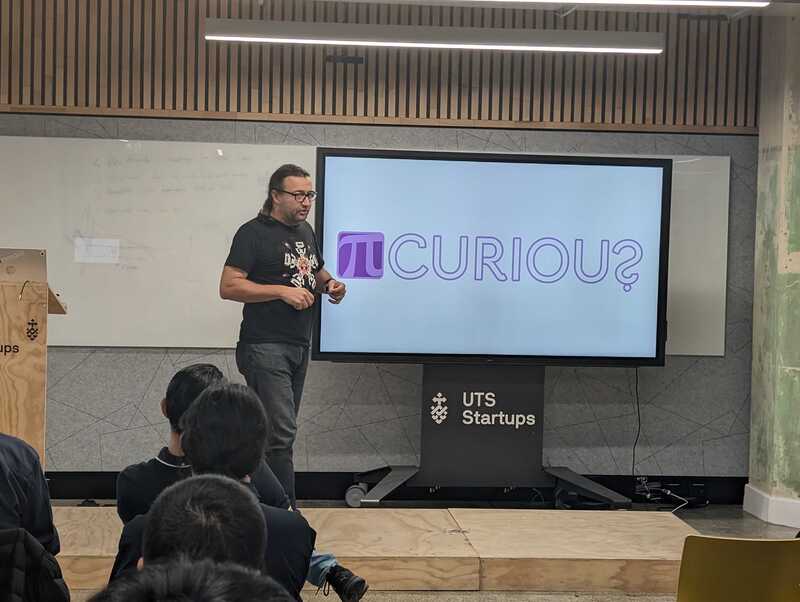
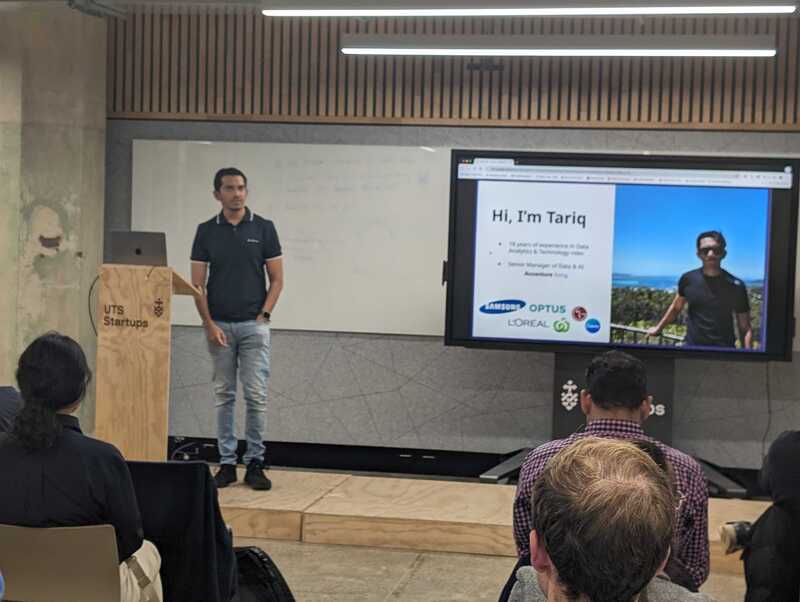
Deep dive into LLMs Tariq UrRahman, Data Science and AI, Accenture Organisation for the "differently organised" Stefan Willoughby, Senior Analytics Specialist, Pi Curious
0 Comments
December 2022
Year in review
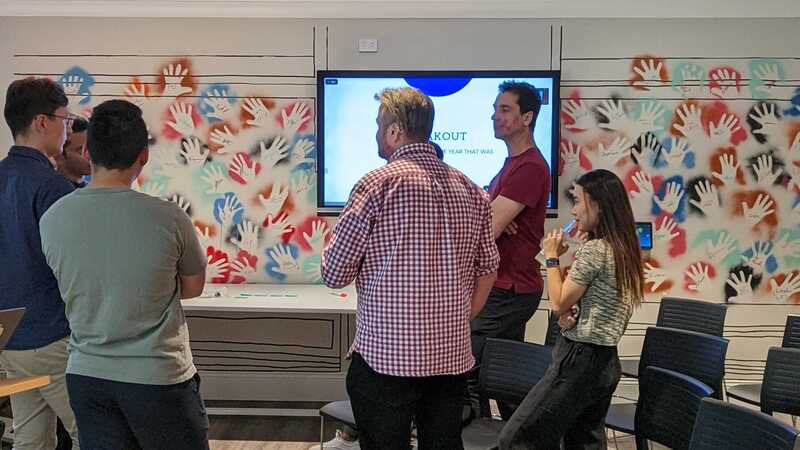
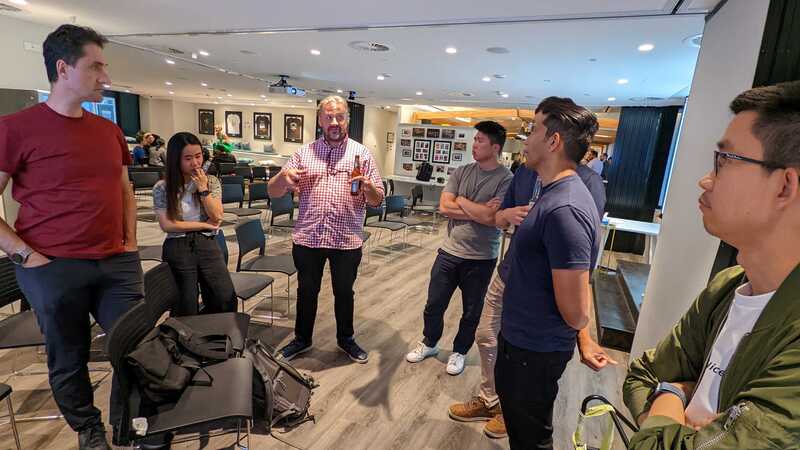
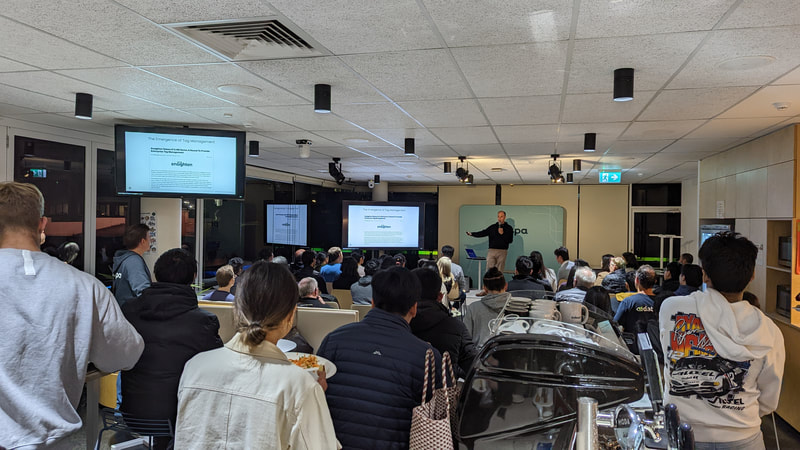
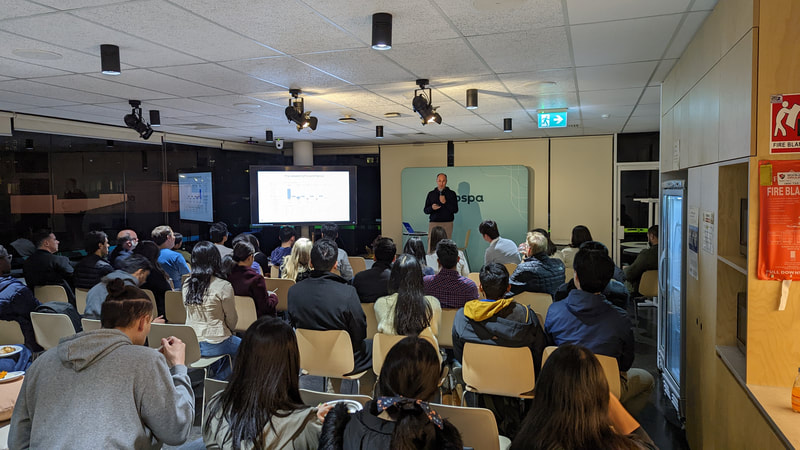
Simon Rumble took us through the year that was, the highs and lows.
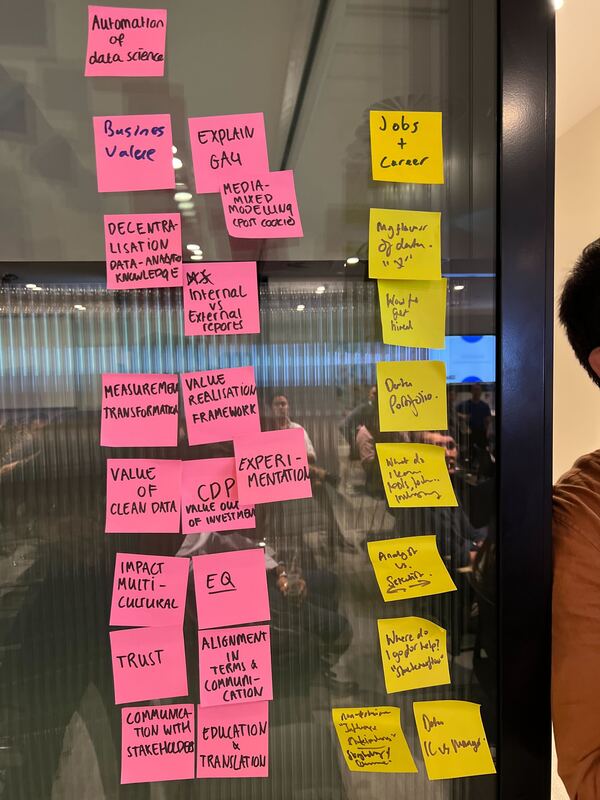
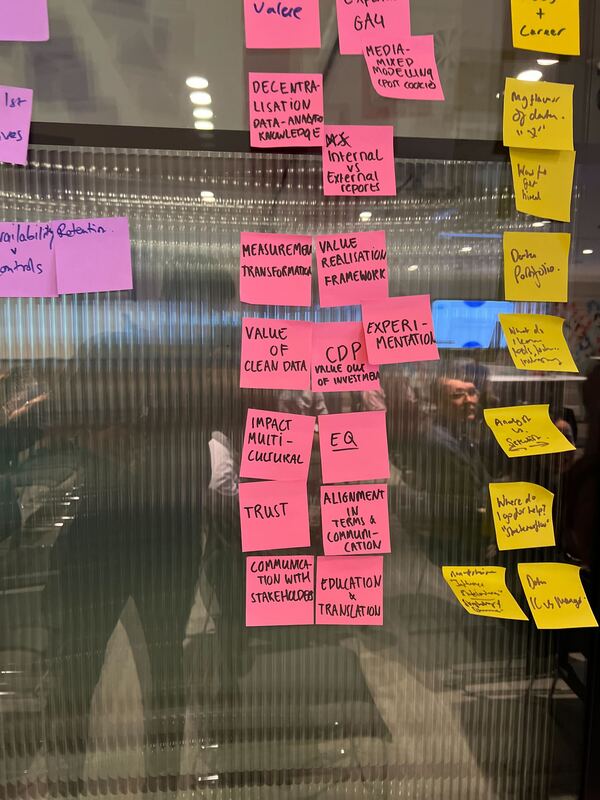
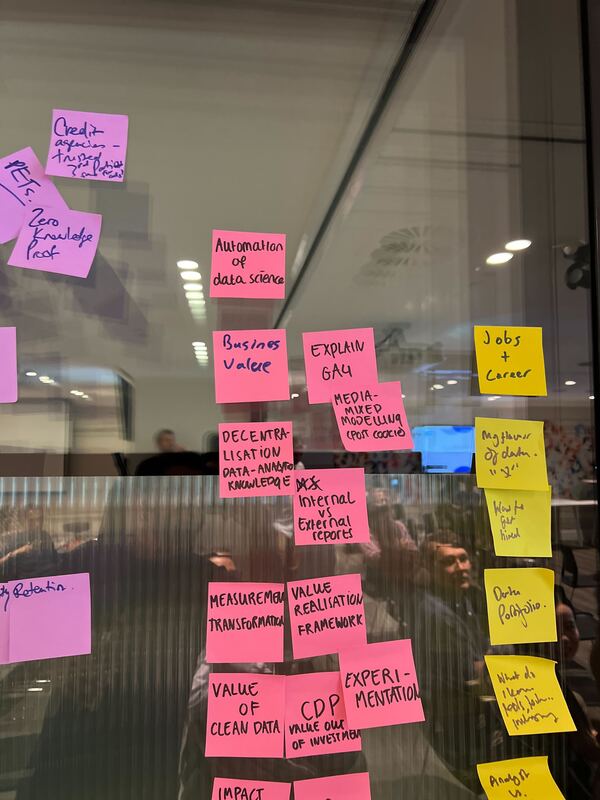
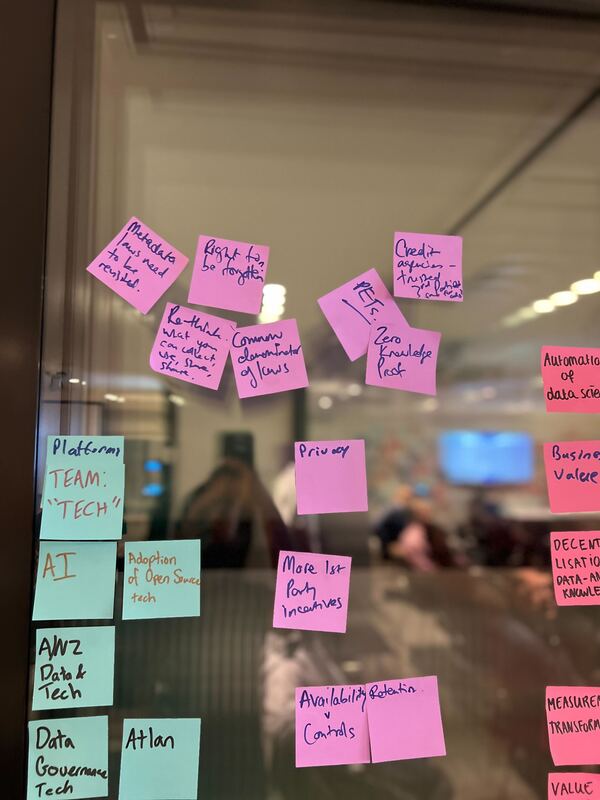
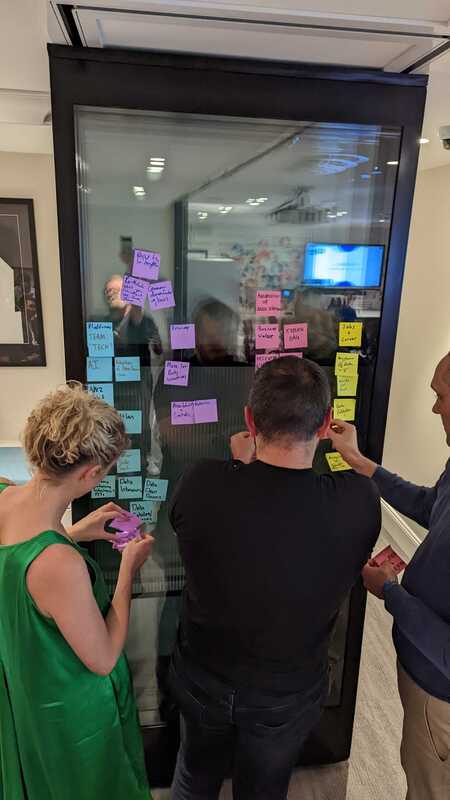
Ideas for 2023
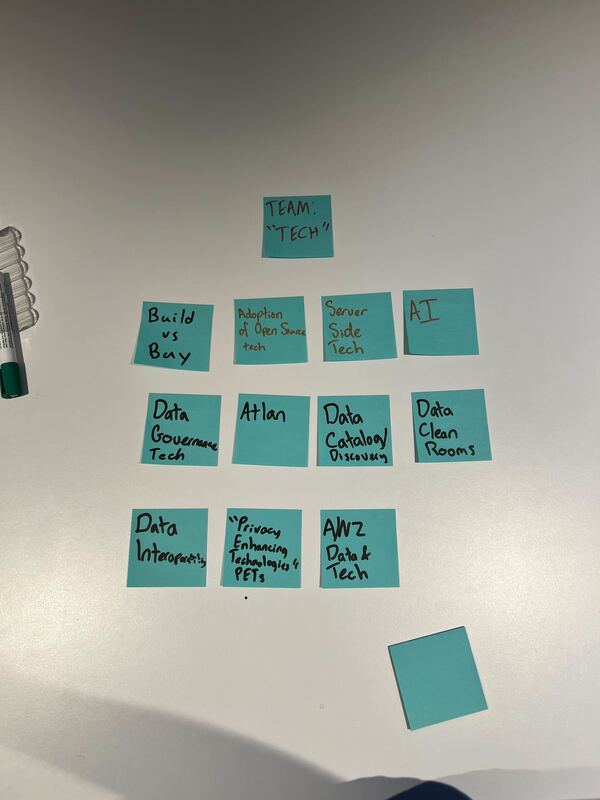
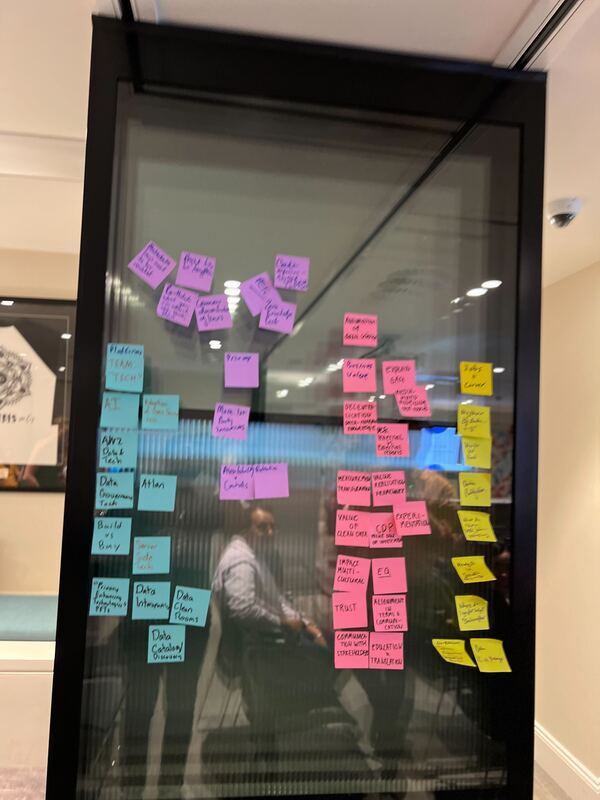
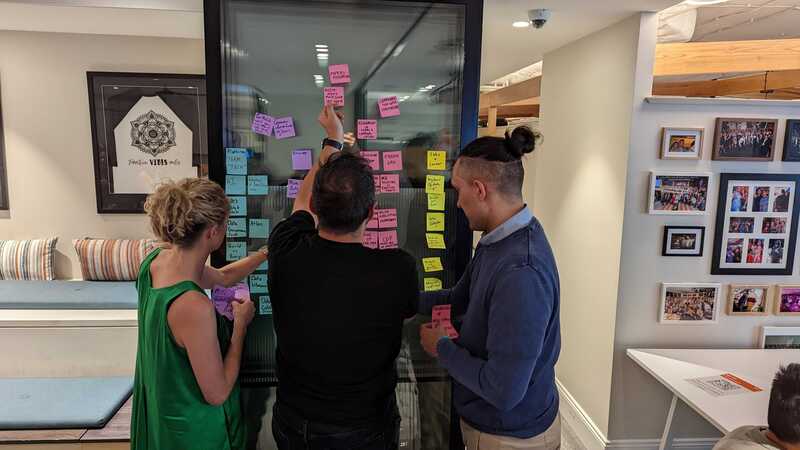
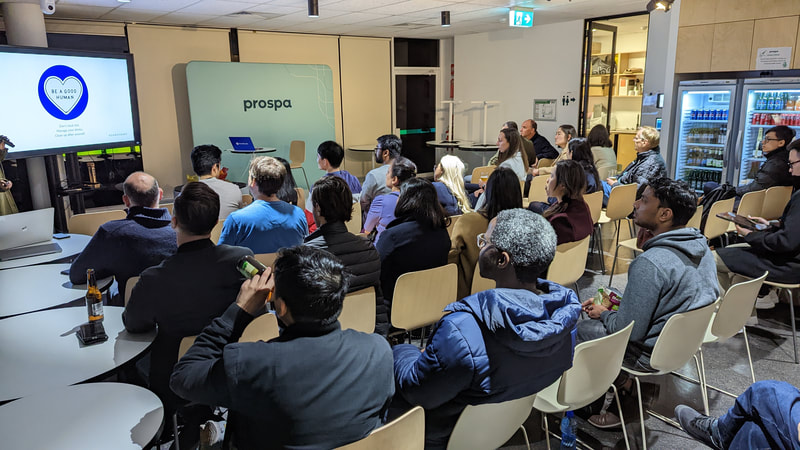
We spent some time going through ideas for 2023, what are the hot topics we should get sessions on a Data & Analytics Wednesday.
Broke everyone into groups under the following “teams”:
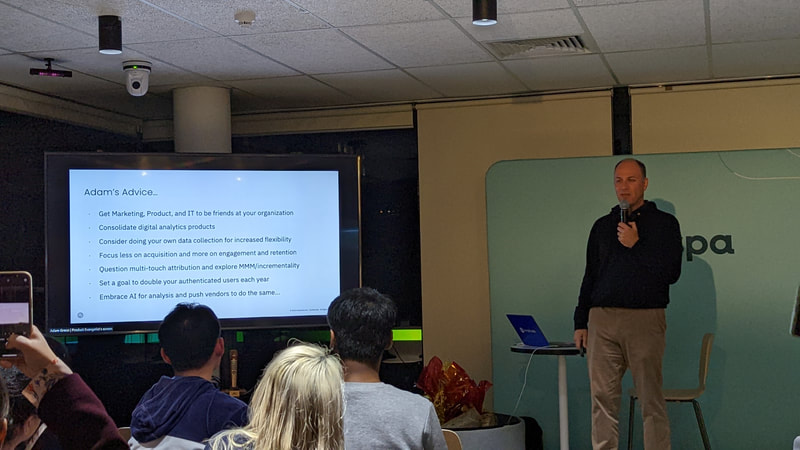
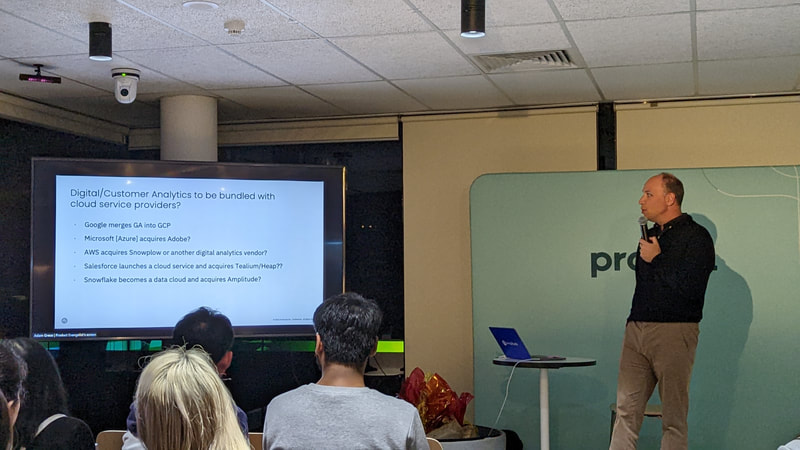
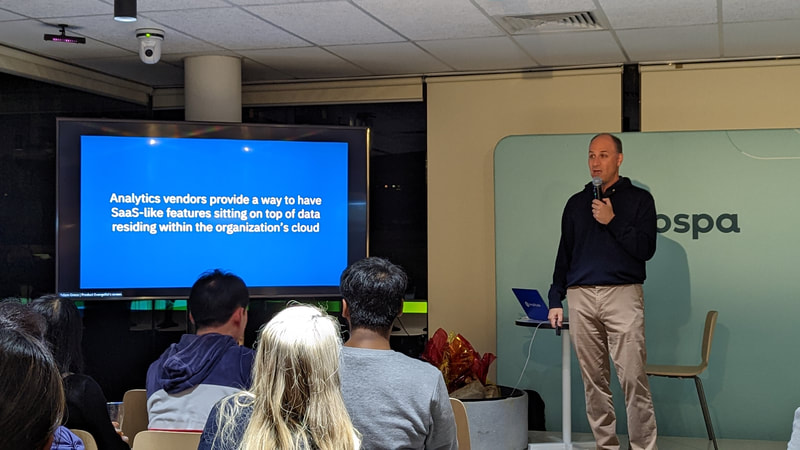
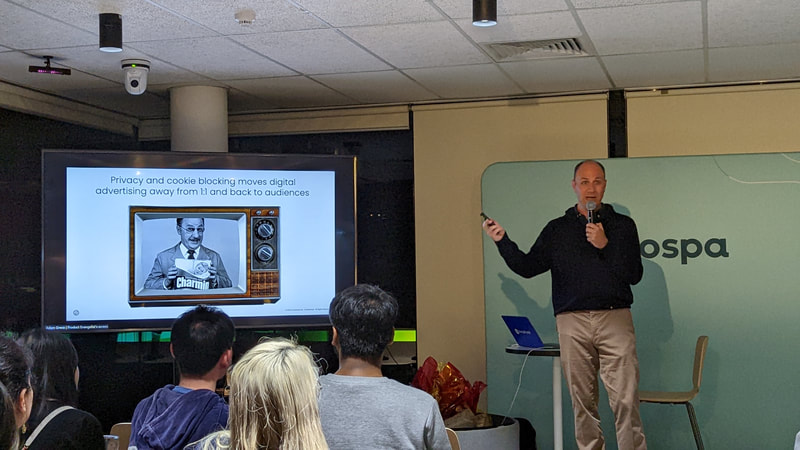
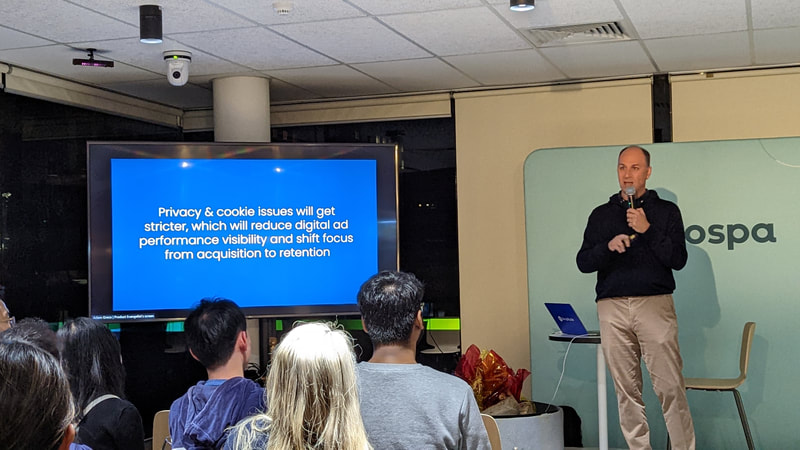
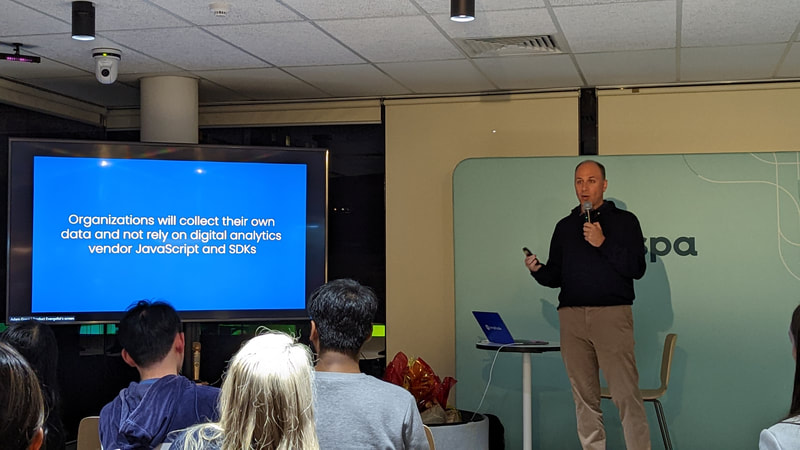
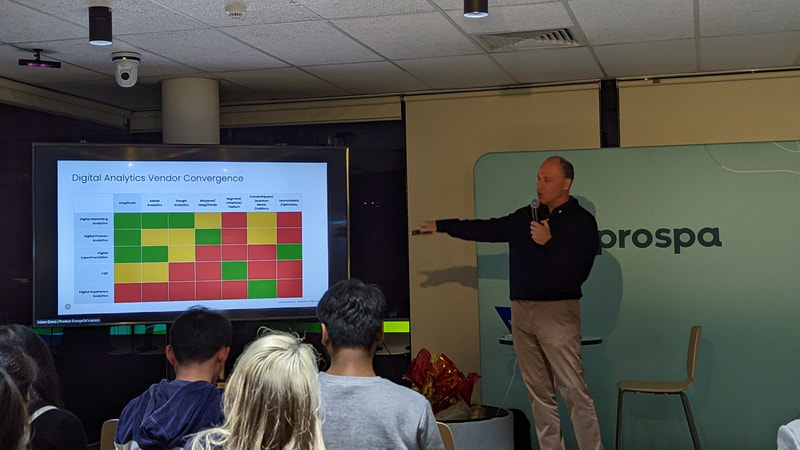
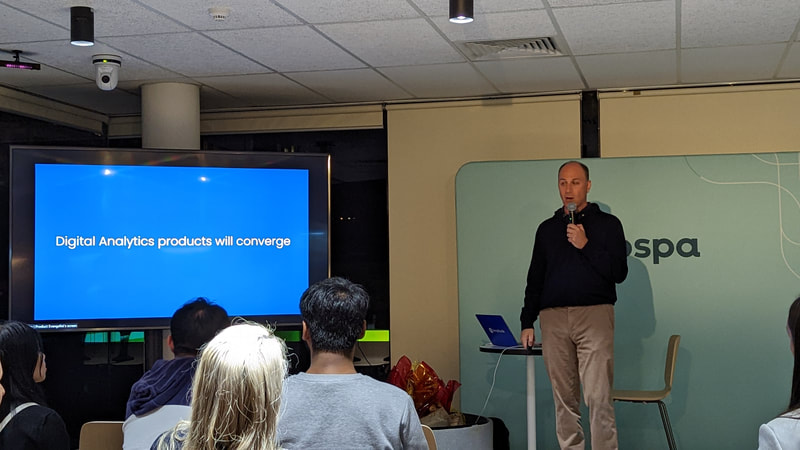
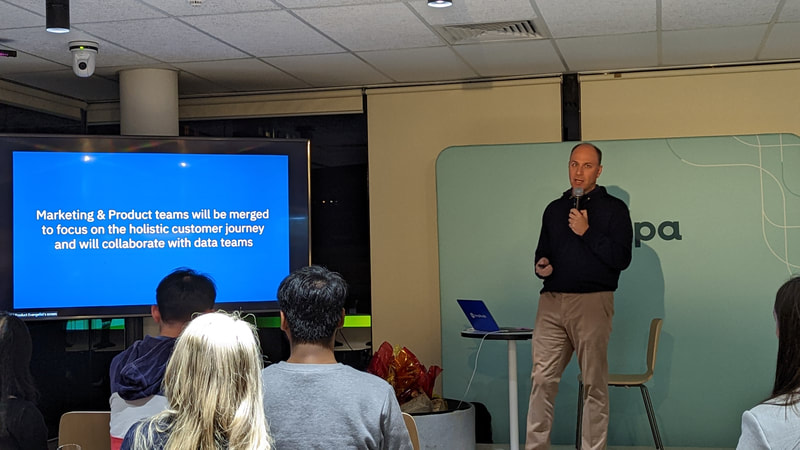
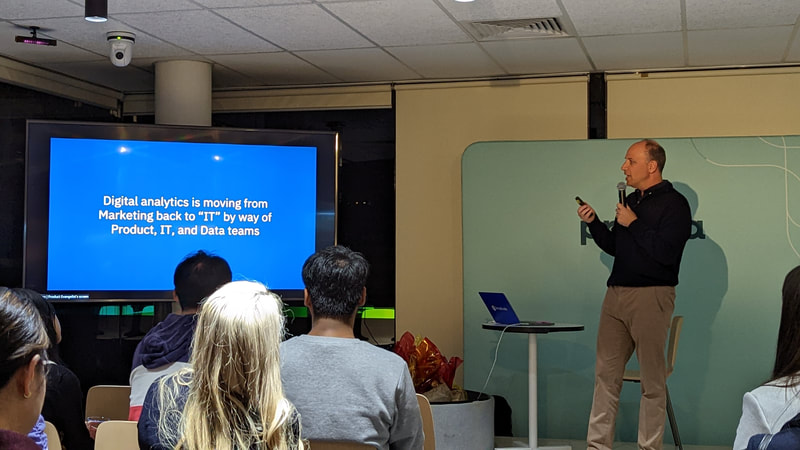
The Past and Future of Digital Analytics Adam Greco, Product Evangelist, Amplitude All about GTM Server-side Jason Lam, Data & Tech Advisor, Civic Data
GA4 Overview
Simon Rumble, Digital Analytics Specialist, ABC
An overview of what Google Analytics is, its benefits and limitations, what we know and what still isn’t clear. Then we’ll hand over to our expert panel to discuss the options, hear from their experience and discuss how things are going.
GA4 Panel
Jonathon Su, Software Engineer, XPON Technologies
Tariq UrRahman, Data & Analytics Director, Jellyfish Jason Lam, Data & Tech Adviser, Civic Data Oanh Trinh, former Manager - Digital Insights, University of Technology Sydney
Our panel of experts discuss their experiences implementing and using Google Analytics 4, the gotchas, the good, the bad, the ugly.
Shanon Chan, Digital Optimisation & Analytics Manager, Aussie
Have you ever wanted Google Analytics’ “User Explorer” data in a aggregated flat table? This type of data is useful for answering questions like “What content do users view before conversion vs after conversion?” and “How many sessions do users of different segments spend on site before conversion?” to help provide the insights to power personalisation. Come along to see the analysis and some of the code used to pull the data that you can use yourself.
BigQuery Scripting - SQL Magic Spells
Pawel Kapuscinski, Data Analyst, Adswerve Imagine enhancing SQL with loops. Want more? Let’s go one step further, imagine your query can decide if it should run based on a provided variable. Not enough? How about constructing queries on the fly and executing them using nothing more than the BigQuery UI. Welcome to the magic world of BigQuery scripting. Juliette O'Brien, Digital and Data Journalist When COVID-19 hit there was huge confusion about numbers. How many people were infected? There were plenty of numbers but they all had different assumptions and rules. Officially-merged numbers took days to give a national picture of Australia on a common basis. Frustrated by the delays and lack of transparency, Juliette set up covid19data.com.au to provide a common view. In this session Juliette talks through the challenges of dealing with different datasets and what she did when datasets changed, moved and switched assumptions. As the crisis has evolved, she has continued to adjust the things she highlights and visualised the data in different ways to suit the changing needs of the audience. Her work has had a big impact, providing the basis for much analysis and discussion of the path the pandemic has taken in Australia and beyond. Our first ever remote DAW happened on April 8th, 2020 with guests joining our Zoom meet from Sydney, Melbourne and New Zealand! The talks were recorded and are available on YouTube.
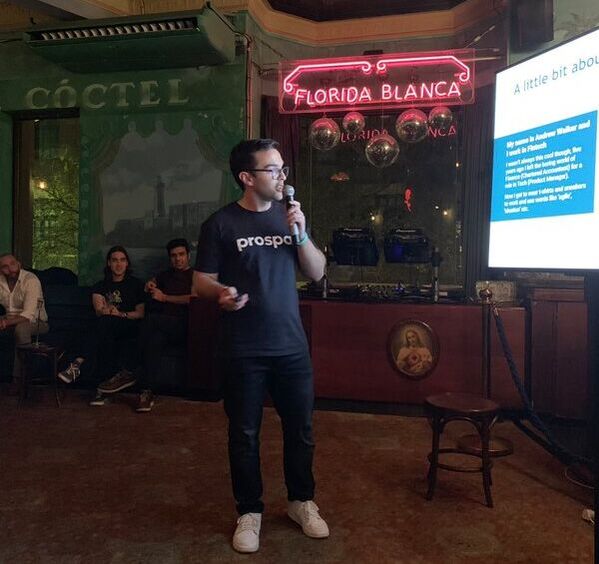
Talks this month were: If Data is the New Oil, What is Behavioural Data? John Ekman, Head of Education, New Republique Since actual behaviour data has been so hard to capture, companies have been stuck with making guesses based on Attitudinal data and Demographical data. But the world has changes. Behaviour data is now plentiful, but companies are still stuck in their old habits. This session shows you the power of behaviour data and how to "unstick" your company. Directionally correct lies vs unintelligible truths, communicating with non-analytics stakeholders Tom Hunt, Head of Data & Analytics, Koala.com How do you talk to stakeholders when they won't pay attention to the detail? Is it better to give a white lie that results in the correct decision or blind them with science? Simon Rumble, Digital Analytics Consultant Andrew Walker Lead Product Manager, Prospa Anyone who has had a seat on a 'rocket ship' can appreciate the tensions experienced when making decisions with data. Sometimes, to maintain momentum and remain agile, sacrifices need to be made. As Lead Product Manager for Organisational Scale at Prospa, Andrew Walker has survived this very journey and is alive to tell the tale (he has the scars to prove it). He covered the tough choices made, particularly in developing Prospa's Credit Decision Engine, in order to move at an industry-leading pace but also maintain a market-leading NPS. Finnian Lattimore Principal Researcher, Gradient Institute Consequential decisions are increasingly being made by AI, like selecting who to recruit, who receives a home-loan or credit card, and how much someone pays for goods or services. AI systems have the potential to to make these decisions more accurately and at a far greater scale than humans, but, if improperly designed they run the risk of doing unintentional harm -- especially to already disadvantaged members of society. Only by building AI systems that accurately estimate the real impact of possible outcomes on a variety of ethically relevant measures can we ensure this powerful technology improves the lives of everyone. This talk focused on the anatomy of these ethically-aware decision-making systems, and some design principles to help the data scientists, engineers and decision-makers collaborating to build them.
Data scientist was described as the sexiest career of the 21st century. Data engineering is one of the fastest growing technical roles. And data analysts? Well, you don’t exactly see people stampeding to Lambda School to become one. I think this should change.
In this session Claire covered why she believed that good data analysts are the most valuable members of a data team. We learnt how you can “scale yourself” by applying software engineering best practices to your analytics code, and how to turn this knowledge into an impactful analytics career.
David spoke about the power of feedback and the data viz community, with regards to him sharing his Game of Thrones death data.
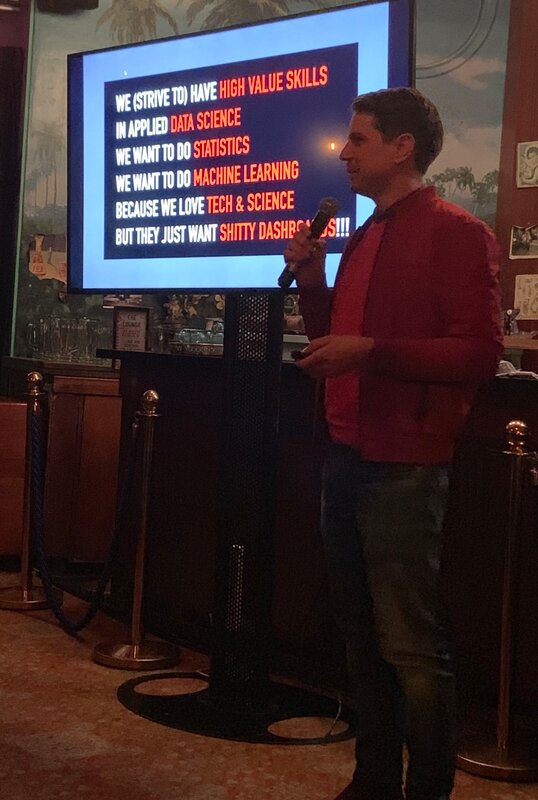
It's an interesting journey that should inspire people to embrace feedback and how crowd sourcing data vizzes can be a super powerful and great learning experience for everyone involved. Willem Paling Director of Customer & Growth Analytics, IAG In this corollary to Austin Byrne's talk in June, Willem shared his team's journey to escape the typical value-providing drudgery of dashboards, reports, and PowerPoints - and move towards more advanced challenges with more diverse, longer term, business values. Is there a binary choice between elementary reporting and advanced statistical work? How do you harness the curiosity, learning, and skills from the latter to motivate and propel your team towards both? This talk put the spotlight on the passionate individuals and how they can actually make differences for customers and their organisation. Kale Temple Co-founder & Practice Director, Intellify Time-series, as a field of study, has largely focused on statistical methods that work well under strict assumptions. Specifically, when there is sufficient history, there is little meta-data and a well-formed auto-correlation structure. However, as an applied practitioner Kale knows that most real-world time series problems violate these assumptions. This leaves us with an opportunity to use more modern time series methods, based on machine learning, to overcome these deficiencies. This session spoke about the unique properties of time-series, how statistical methods work and how and why machine learning (and deep learning) methods can be used to improve accuracy. Let's face it: your job rarely involves the depth of technology and innovation read on Airbnb's Data blogs. Over the past ten years, Austin has come to see a trend across hundreds of analytics professionals: we are an unhappy bunch when we feel there is more advanced analytics work being done by our peers. This is true even in "cutting edge" companies, based on his experience working on and leading several Analytics teams at Facebook and Atlassian. He lends thoughts into why he think this plight exists, share what he feels is a representative view into the "normal" work done by the majority of analytics professionals in companies of all sizes, and contest what "impactful" really means to an analyst job-well-done.
Hosted by Simon Rumble
Louis Rankin Insights Manager, Rezdy So, you need an SQL data model but don't know how to get started? This talk was about Rezdy's journey using DBT over the last 7 months, and the things you may need to consider as you're getting started. Andrea Lau Director, Small Multiple How can you leverage skills and tools you already have to create charts and data viz that are useful to others? We learnt about the three parts of a good data viz and some general tips and tricks for making charts that support day-to-day reporting and communications. A brief history of the evolving role of data in the customer experience, and an overview of the key platform “categories” in play. Aimed at anyone overwhelmed by acronyms and trying to answer “what does what? Rod Jacka Managing Director, Panalysis Creating exceptional customer experiences is a key component to success in today's digital world. Google Analytics is a powerful tool to help you understand the journey your customers take, but has so many options and so much data, it can be hard to get started. By taking a structured approach to your analytics you can learn a lot about the customer's journey and identify areas for improvement - by tackling your own customer journey map using what's possible in Google Analytics.
Simon Rumble
Principal Developer Advocate, Poplin Data
Raw event data like you get from GA360, Adobe Analytics or Snowplow gives you much more information than the aggregated data you see through reports but they can be unwieldy to use. Building an SQL data model allows you to build centralised business rules for things like conversions, traffic sources and rollup events while still being able to change them. When something screws up, you can paper over those changes so your business users only see a perfect timeline. This talk walked through building a data model on top of raw Snowplow data using reasonably simple SQL.
Tableau was a game changer for interactive data visualisation and analysis. It hasn't been quite as strong as an enterprise Business Intelligence tool. Nicholas has worked with Tableau for over 7 years and is currently responsible for every aspect of its deployment in his organisation. In this talk he shared from his experiences some of the strengths, weaknesses, and then demonstrated some more advanced technical tips/tricks/hacks that he's developed over the years. (e.g. manicured self-service, drill-through and big data). |
�
Categories
All
Archives
May 2024
|















 RSS Feed