|
Shanon Chan, Digital Optimisation & Analytics Manager, Aussie
Have you ever wanted Google Analytics’ “User Explorer” data in a aggregated flat table? This type of data is useful for answering questions like “What content do users view before conversion vs after conversion?” and “How many sessions do users of different segments spend on site before conversion?” to help provide the insights to power personalisation. Come along to see the analysis and some of the code used to pull the data that you can use yourself.
0 Comments
Hosted by Simon Rumble
How can you tell when people are actively engaged with your content, not just clicking a vacuous headline? Once you know, how do you distribute this information around the business to help optimise content creation?
This month’s panel session featured great minds who’ve been working and thinking deeply on these matters in publishing and content marketing. We covered the challenges faced by digital publishers, platforms and solutions to the problems, and approaches to getting the data to the decision makers
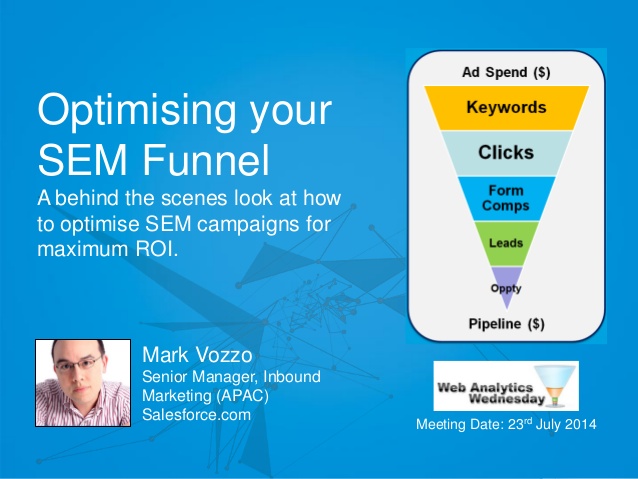
The Battle for Your ClickBecoming Less Wrong - A guide to basic statistics and probability - Part 1How to optimise your Google Adwords (SEM) FunnelMark Vozzo, Inbound Marketing, Salesforce.com Measuring engagement Tim Elleston, Director and Analyst, Digital Balance |
�
Categories
All
Archives
May 2024
|


 RSS Feed