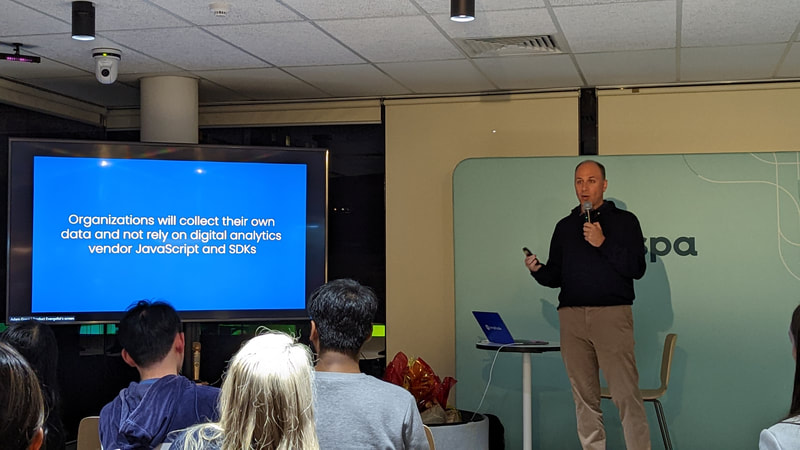
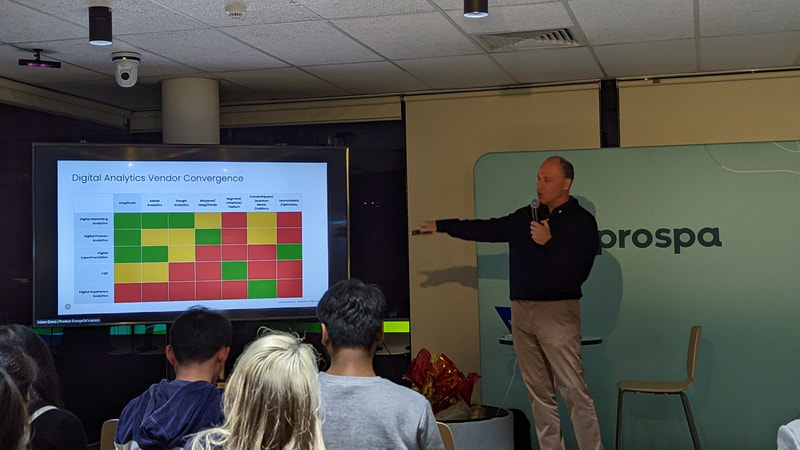
The Past and Future of Digital Analytics Adam Greco, Product Evangelist, Amplitude All about GTM Server-side Jason Lam, Data & Tech Advisor, Civic Data
0 Comments
GA4 Overview
Simon Rumble, Digital Analytics Specialist, ABC
An overview of what Google Analytics is, its benefits and limitations, what we know and what still isn’t clear. Then we’ll hand over to our expert panel to discuss the options, hear from their experience and discuss how things are going.
GA4 Panel
Jonathon Su, Software Engineer, XPON Technologies
Tariq UrRahman, Data & Analytics Director, Jellyfish Jason Lam, Data & Tech Adviser, Civic Data Oanh Trinh, former Manager - Digital Insights, University of Technology Sydney
Our panel of experts discuss their experiences implementing and using Google Analytics 4, the gotchas, the good, the bad, the ugly.
Shanon Chan, Digital Optimisation & Analytics Manager, Aussie
Have you ever wanted Google Analytics’ “User Explorer” data in a aggregated flat table? This type of data is useful for answering questions like “What content do users view before conversion vs after conversion?” and “How many sessions do users of different segments spend on site before conversion?” to help provide the insights to power personalisation. Come along to see the analysis and some of the code used to pull the data that you can use yourself. Rod Jacka Managing Director, Panalysis Creating exceptional customer experiences is a key component to success in today's digital world. Google Analytics is a powerful tool to help you understand the journey your customers take, but has so many options and so much data, it can be hard to get started. By taking a structured approach to your analytics you can learn a lot about the customer's journey and identify areas for improvement - by tackling your own customer journey map using what's possible in Google Analytics. The Great DebateGoogle Analytics vs Adobe Analytics vs Snowplow Insights.
Winners
|
�
Categories
All
Archives
May 2024
|


 RSS Feed